Introduction
Take a look at this picture:
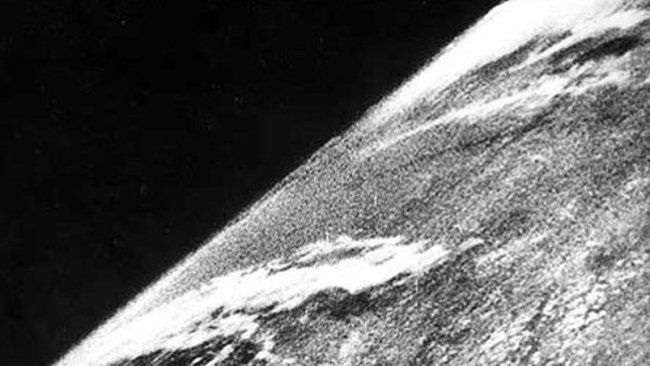
This is one of the first images taken from space. It was captured in 1946 at an altitude of 105 km with a 35mm camera mounted on a V2 missile. These images were captured on physical film, which would fall back to Earth and be recovered manually—though not without challenges. Needless to say, these early experiments were strictly military in nature.
By 2018 nearly 950 satellites were orbiting our planet, of which only about 9% were remote sensing satellites (approximately 80 satellites in total). But in the last 6 years, there was an exponential increase in satellites orbiting Earth: nearly 10000 satellites are orbiting our planet by the end of 2024.
Remote sensing can be categorized by the altitude at which the sensing equipment operates, as this influences the type of data collected, the scale, and the applications.
- Aerial Remote Sensing, which is usually conducted from airplanes, drones, or balloons at altitudes ranging from a few hundred meters to a few kilometers.
- Satellite Remote Sensing: conducted by the different types of satellites orbiting the Earth.
In this article we will focus mainly on Satellite Remote Sensing, although most of the discussion can be applied to aerial and drones as well.
Remote sensing definition
Remote sensing is the acquisition of information about an object or phenomenon without physical contact with the object. The term generally refers to the use of aerial sensors to detect and classify objects on Earth, primarily through capturing the electromagnetic signals that our planet emits or reflects, including those within the visible spectrum. In summary, it is the set of techniques used to determine, from a distance, the properties of natural or artificial objects based on the rays that they emit or reflect.
As mentioned before, remote sensing can be categorized by the altitude at which the sensing equipment operates. In the case of satellite remote sensing, satellites are further characterized by the orbit in which they operate:
- Low Earth Orbit (LEO) Remote Sensing: Satellites in LEO orbit at altitudes of 200–2,000 km, capturing high-resolution images over relatively small ground areas. This is the most common orbit for Earth observation satellites (e.g., Landsat, Sentinel-2), used for tasks like environmental monitoring, resource management, and disaster response.
- Medium Earth Orbit (MEO) Remote Sensing: Positioned at altitudes between 2,000 and 35,786 km. While MEO is more commonly associated with GPS and navigation satellites, some remote sensing satellites in this orbit help with global weather and atmospheric monitoring, though with lower spatial resolution than LEO satellites.
- Geostationary Orbit (GEO) Remote Sensing: These satellites are positioned around 35,786 km above the equator and orbit in sync with Earth’s rotation, remaining fixed over a specific region. They’re used primarily for weather observation and climate monitoring due to their continuous, large-scale coverage. Examples include the GOES and Meteosat satellites. This is a very particular case because satellites orbiting at GEO are basically fixed in space with respect to the Earth: they are always looking at more or less the same place. This is the typical case of climatological satellites.
How does remote sensing work?
In general, each satellite has one or more instruments that are used to obtain measurements from the Earth. Usually, the rays received by the instrument are captured and converted into an electrical signal by a detector, then digitized point by point (pixels) to be subsequently transferred to Earth. Each pixel has an associated number proportional to the ray emitted from the corresponding point (the intensity of the original signal). This process to capture, measure and quantize the amount of energy received to create the corresponding pixel value is known as "'radiometry".
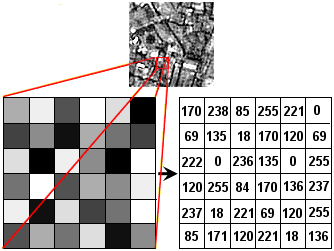
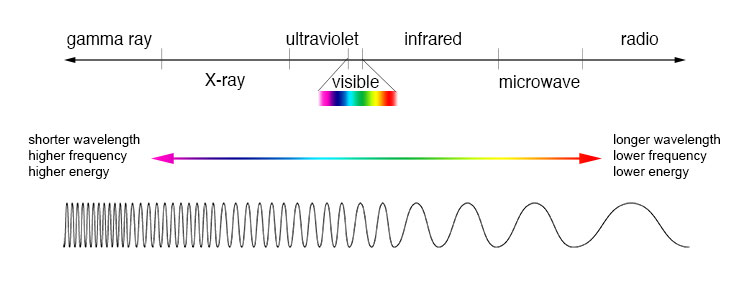
Among the electromagnetic signals used for remote sensing, the following can be highlighted:
- The visible spectrum: from 400 nm to 700 nm.
- The visible + infrared spectrum (where multispectral satellites typically operate).
- Microwaves, where SAR satellites, based on radar, operate.
Different types of remote sensing
As we mentioned at the beginning, remote sensing or teledetection is the set of techniques used to determine, from a distance, the properties of natural or artificial objects based on the electromagnetic signals that they emit or reflect. These signals are captured by the different sensors on a satellite. These sensors can be classified into two types: passive, which only receive rays emitted by external sources (e.g., all optical satellites that operate in the visible spectrum), and active, which emit rays that are then detected when reflected back from the Earth. This includes radar or lidar-type sensors.
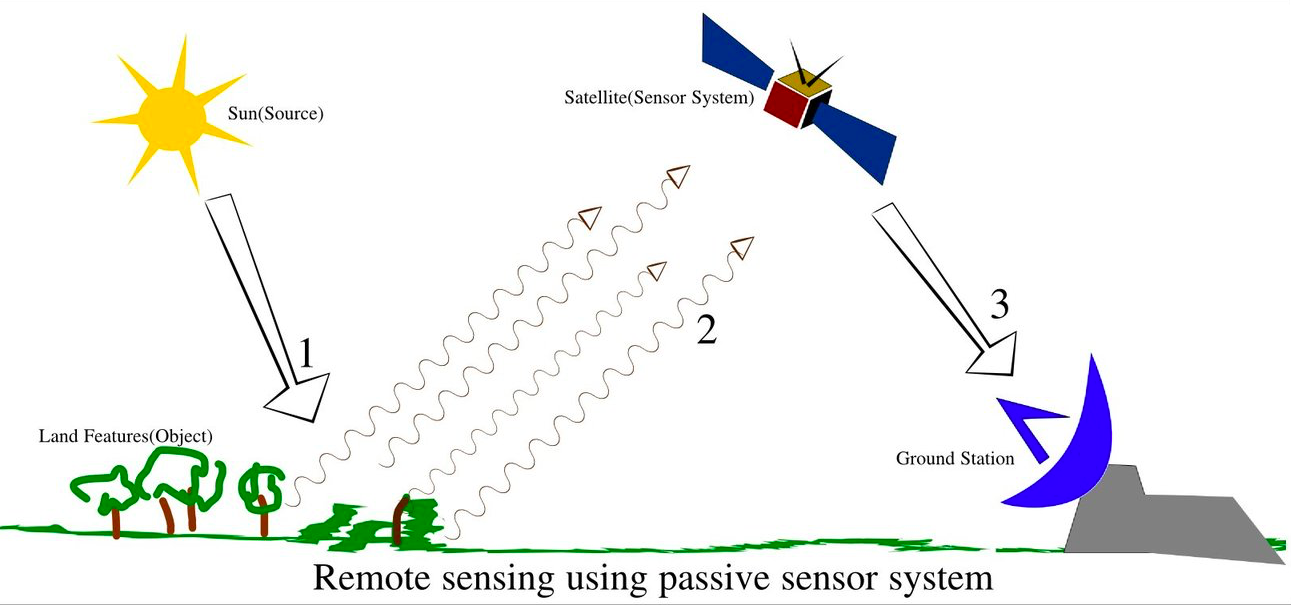
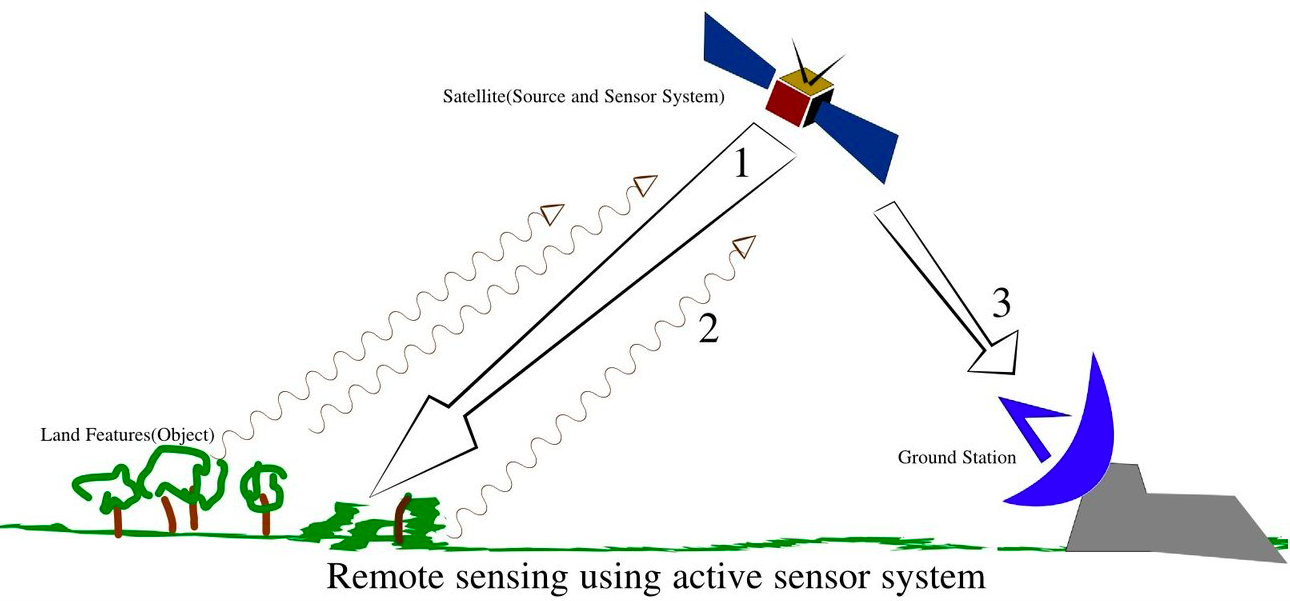
Passive satellites rely on external sources of radiation, capturing the natural electromagnetic energy reflected or emitted by the Earth's surface. These satellites cover various parts of the electromagnetic spectrum, such as the visible, ultraviolet, and infrared ranges. Key programs include the Landsat family and Sentinel-2, known for monitoring land use and environmental changes, as well as MODIS, which offers daily global coverage essential for climate studies. Additionally, many Very High Resolution (VHR) satellites, such as WorldView, QuickBird, and GeoEye, as well as most commercial nanosatellites like those in the PlanetScope constellation or from the Satellogic constellation, fall into this category.
Active satellites have onboard sensors that emit their own signals, typically using radar (which is the use of specific bands within the microwave portion of the electromagnetic spectrum), to capture detailed information about the Earth’s surface. Unlike passive systems, they are unaffected by weather conditions or daylight, making them invaluable for a wide range of applications. SAR (Synthetic Aperture Radar) satellites are the most common active systems, with notable examples including Sentinel-1 and Cosmo-SkyMed. Additional active satellites include the RADARSAT series, ALOS-2, and TerraSAR-X, each providing high-resolution radar data used for tasks like mapping terrain, monitoring agriculture, and assessing natural disasters.
Together, these satellites represent a vast toolkit for observing and analyzing the Earth’s surface, supporting a range of applications from environmental monitoring to emergency response and climate research.
Image Quality
The electromagnetic signals reflected or emitted by the object being sensed are captured by a sensor onboard the satellite. Broadly speaking, we can say that the information obtained by a particular sensor is represented as a pixel in an image. Each pixel in the image then has two basic values: the radiometric or physical value of the pixel and its position on the ground, usually defined within a coordinate system (for example, latitude, longitude, and elevation). This pixel in the image has some values that determine the quality of the final product, it is known as the image quality, and it is characterized across three main domains:
- Image Geometry: Relates to precise pixel positioning on Earth and relative pixel location. This includes factors like location accuracy, distortion, scale alteration, spectral overlap, planimetric and altimetric precision.
- Image Radiometry: Refers to the levels measured at each sampling point, covering aspects like radiometric noise and resolution.
- Image Resolution: Concerns the system’s ability to capture fine details in the scene, influenced by sampling intervals, transfer functions, and more.
How to select the correct remote sensing data for my problem?
Given the myriad options, choosing the correct data can be difficult. In this section, we will provide a set of characteristics that will determine the selection. These characteristics can be grouped into three different resolution categories: spatial resolution, temporal resolution, and spectral resolution.
- Spectral resolution: the segment of the spectrum that the satellite senses.
- Spatial resolution: the area on the ground that each pixel represents (m²)
- Temporal resolution: the time interval between observations of the same point on the ground.
The spectral resolution clearly determines what is sensed from these three resolutions, so we will start with it.
Spectral resolution
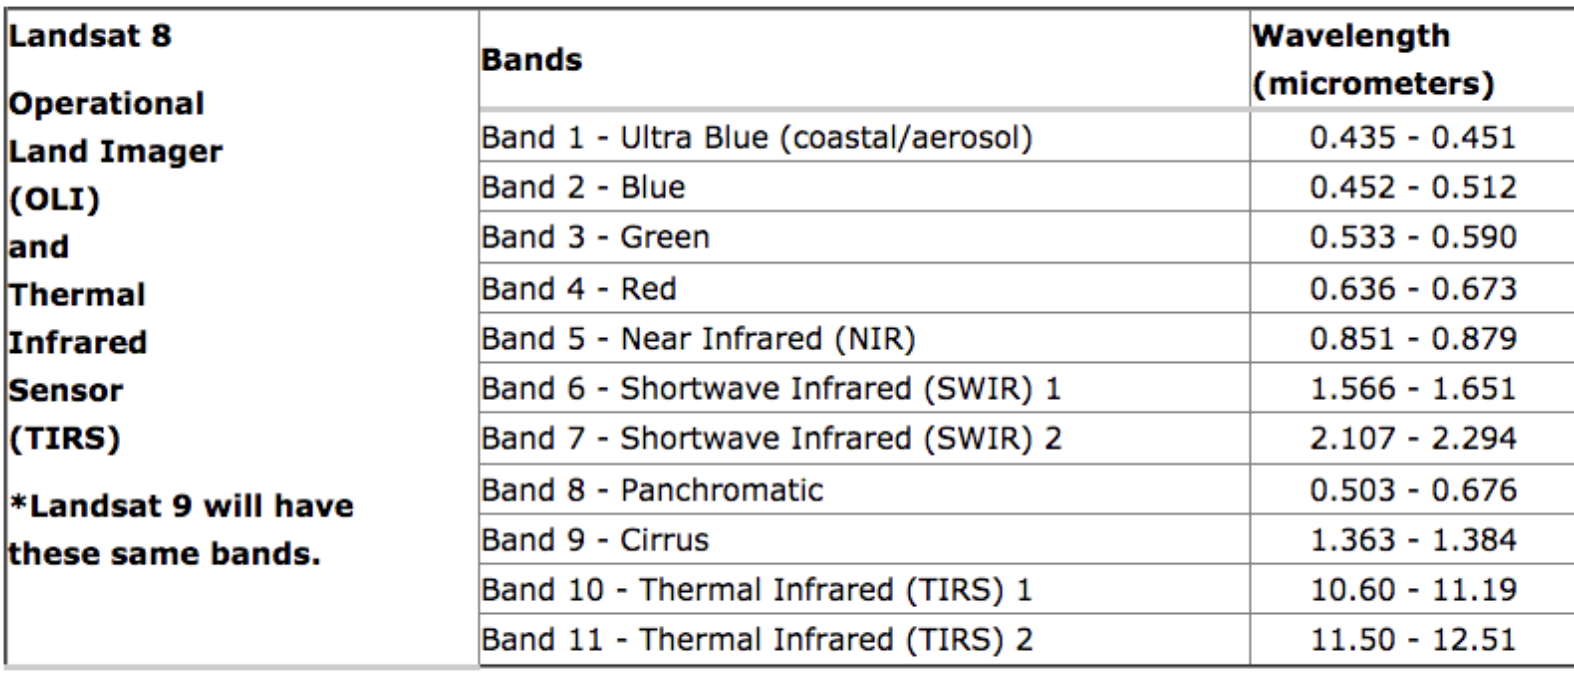
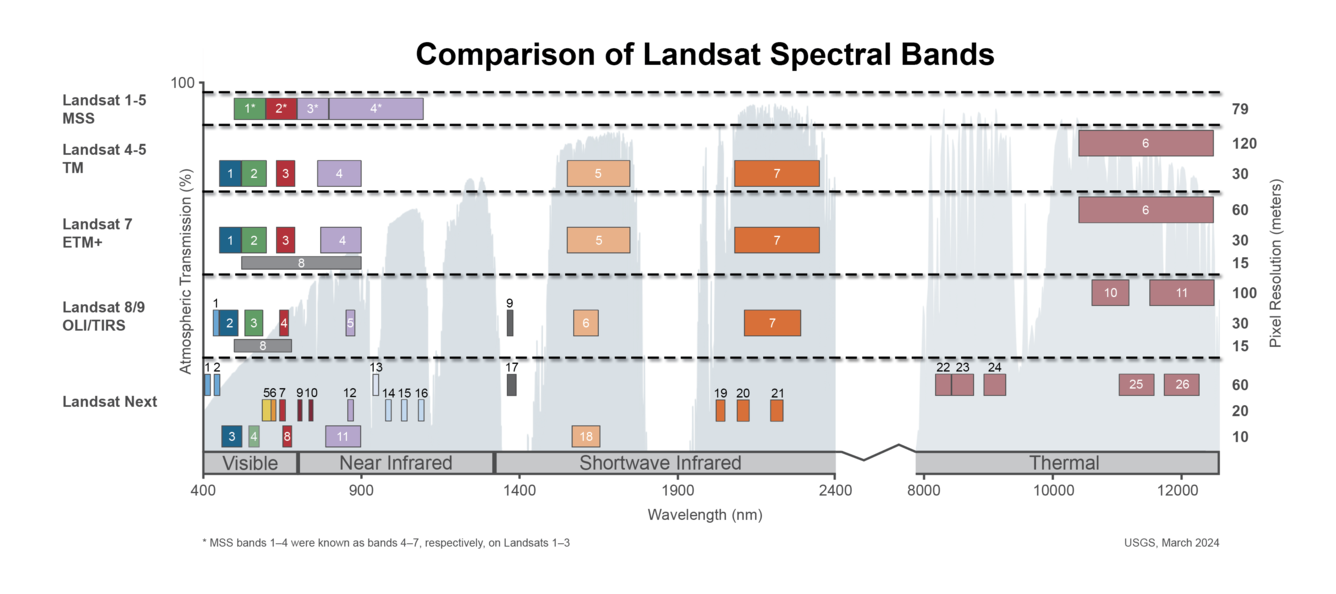
Spectrometry is the measurement of the interactions between light and matter, and the reactions and measurements of radiation intensity and wavelength. The matter reacts differently to different wavelengths (the most obvious example is the visible light, which reflects the colors of the different objects). Independently of the satellite type (passive or active), the sensor will capture a range of the spectral band: the size of this range is called the spectral resolution. For instance, Landsat 8 captures the following spectral bands:
The following images correspond to the Green, Red and Blue spectral bands:
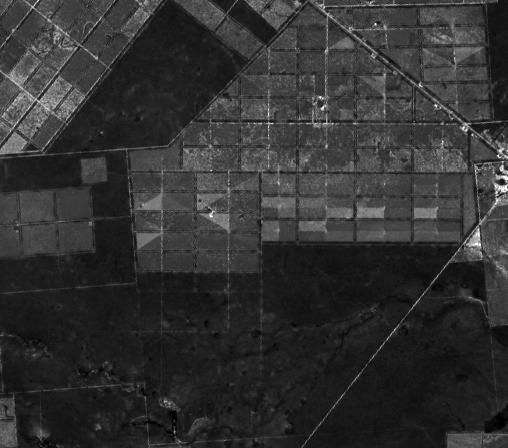
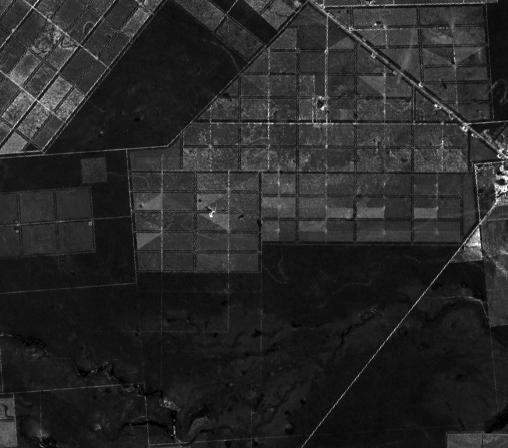
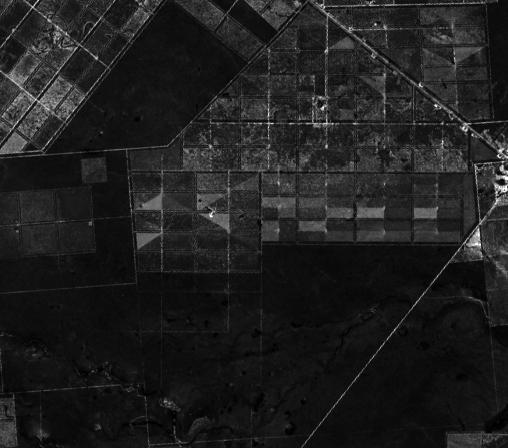
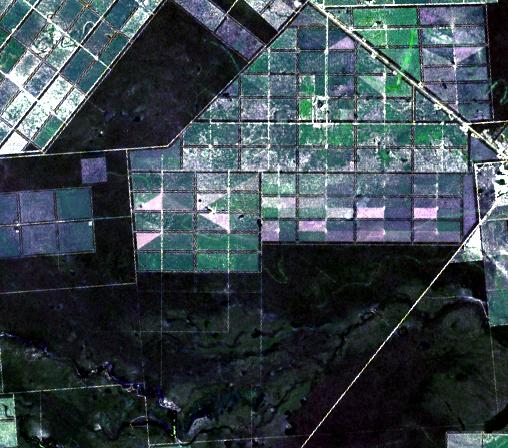
These bands are quite useful for a lot of remote sensing applications. In fact, by combining the three images into a three-channel image (the typical image we are used to see), we obtain a color image that can be easily interpreted:
Spectral bands can also be combined to highlight relevant information. For instance, one of the most used spectral band combinations to analyze vegetation is NDVI (Normalized Difference Vegetation Index), a combination of the Red and NIR bands. The following is an NDVI image representation of the same scene:
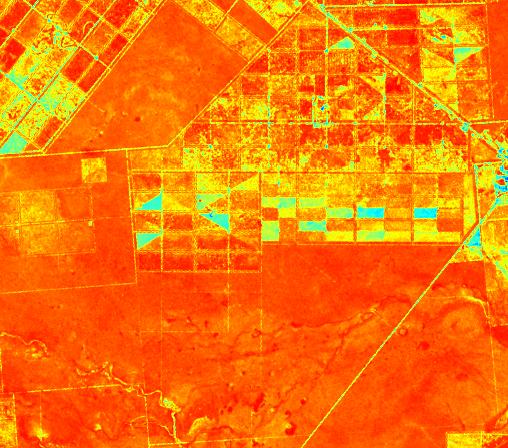
In this case, we've used a false color palette to highlight the different values of the index.
We can also take a look at the thermal bands. These bands are highly correlated with the surface temperature and can be used to estimate temperature values:
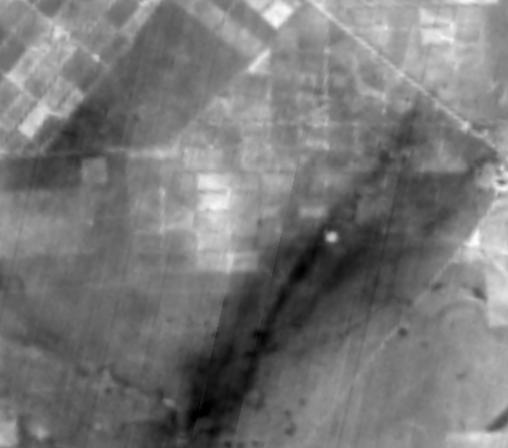
Again, it is easier to visualize the differences in temperature if we use a specific false color palette to create a color representation. We can also use different palettes to obtain different representations:
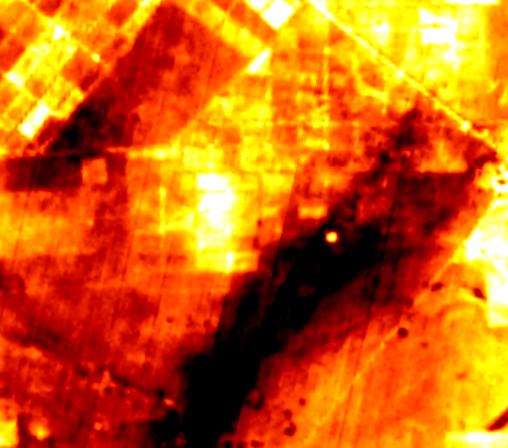
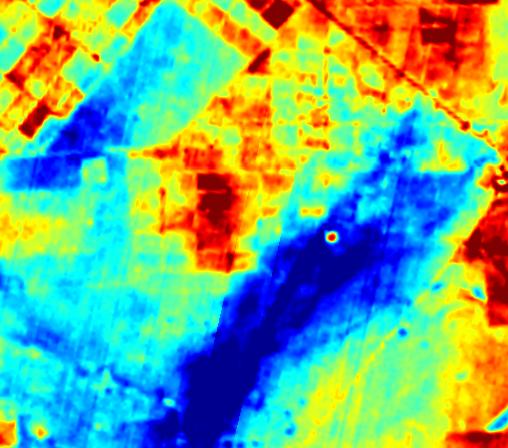
Two representations of the same thermal band image. Note the red circle inside the blue region: this is a "hot" area due to a clearing in the vegetation.
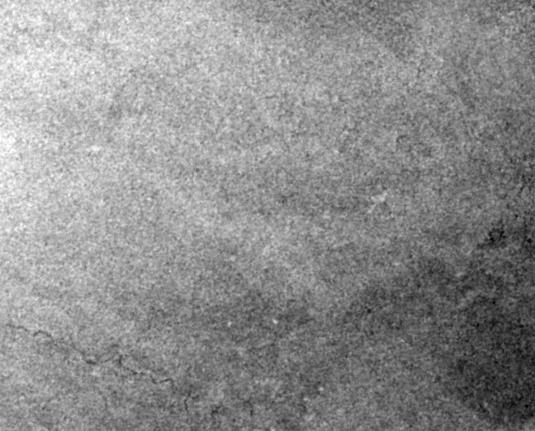
Spectral resolution is not only restricted to optical images. Active satellites also define spectral resolution, this time related to the wavelength used to send the signal to the Earth. For instance, Sentinel-1 satellites operate on what is known as "C-Band", which is part of the microwave spectrum, with a wavelength of 5.6 cm (or a frequency of about 5.405 GHz). This C-band radar is used for synthetic aperture radar (SAR) imaging, allowing it to penetrate clouds, operate day or night, and provide high-resolution imagery regardless of weather conditions. This capability makes Sentinel-1 particularly useful for applications such as monitoring land deformation, sea ice, oil spills, and forest changes. Let's see an example of Sentinel-1 images on the same area used for the Landsat images:
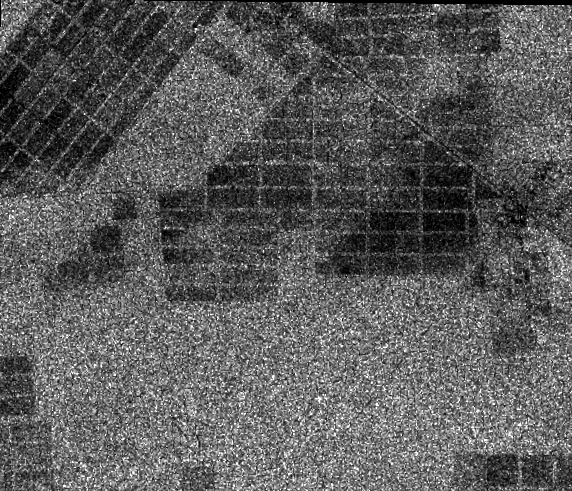
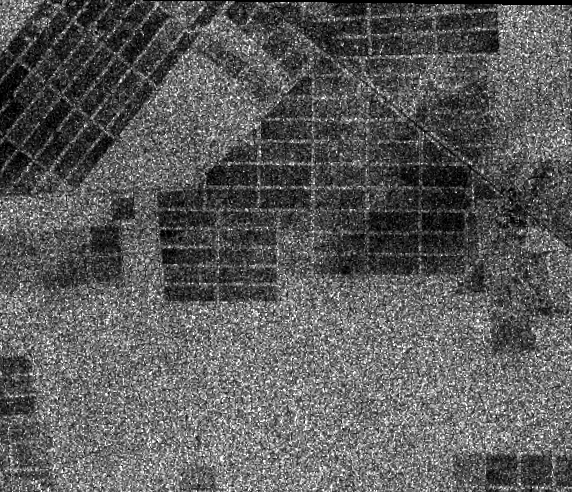
We can also look at another portion of the microwave section of the electromagnetic spectrum: X-Band, which typically operates in frequencies from 8 to 12 GHz (or wavelengths of about 2.5 to 3.75 cm). Some examples of X-Band are the TerraSAR-X constellation and COSMO-SkyMed constellation.
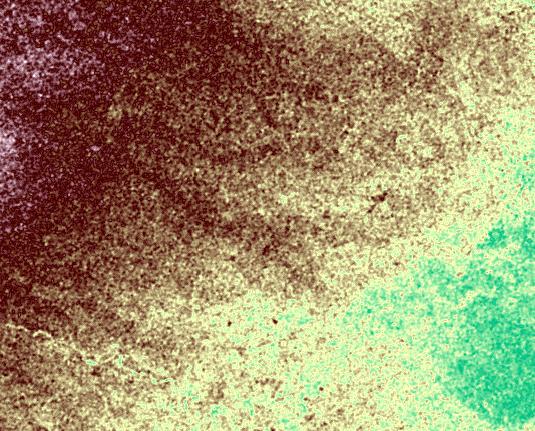
Using a combination of C-Band and X-Band images, one of the most widely used elevation models were generated in the 2000 with the Shuttle Radar Topography Mission (SRTM), creating a near-global digital elevation model (DEM) of Earth's surface, covering about 80% of the Earth’s landmass(from 60°N to 56°S latitude) with a resolution of 30 meters per pixel. The next images illustrates the SRTM DEM for the same scene as before:
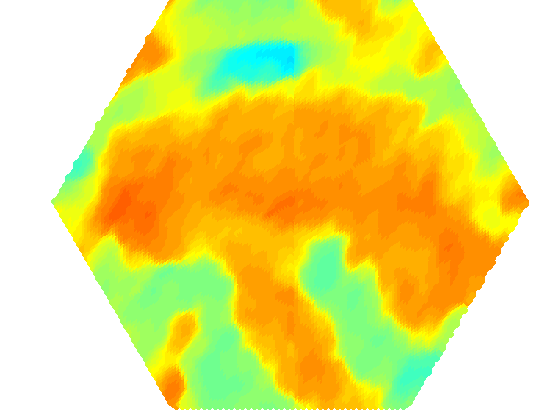
We want to end this section by mentioning SMOS: a special case of a passive satellite operating in the spectrum's microwave segment. This satellite receives the signal emitted by the Earth on the L-Band segment of the spectrum at a frequency of 1.4 GHz (corresponding to a wavelength of approximately 21 cm). This lower-frequency L-band microwave is particularly well-suited for measuring soil moisture and ocean salinity because it penetrates the surface layer of soil and water, providing valuable data on moisture levels and salinity that are essential for climate and environmental studies (more on this later).
Spatial resolution
One of the key properties of a remote-sensing image is the spatial resolution. Spatial resolution in a satellite image refers to the size of the smallest object or detail that the satellite sensor can detect on the Earth’s surface. It is typically expressed in meters, with smaller values indicating higher resolution and more detailed imagery. For example, a satellite image with a 10-meter spatial resolution means that each pixel in the image represents a 10m x 10m area on the ground, allowing finer details to be captured compared to an image with a 30-meter resolution, where each pixel covers a 30m x 30m area.
High spatial resolution (from a few meters to centimeters) is essential for applications requiring detailed imagery, like urban planning or precision agriculture. In contrast, lower spatial resolutions are often sufficient for broader environmental monitoring. Clearly, spatial resolution is critical depending on the problem we want to solve using remote sensing data.
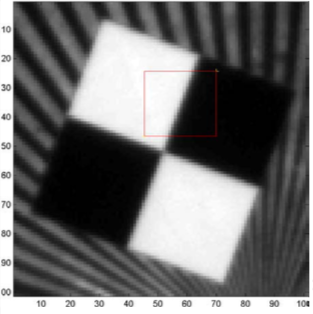
Related to spatial resolution is the concept of image resolution, which relates to the system's overall ability to capture fine details. Consider for instance, this image:
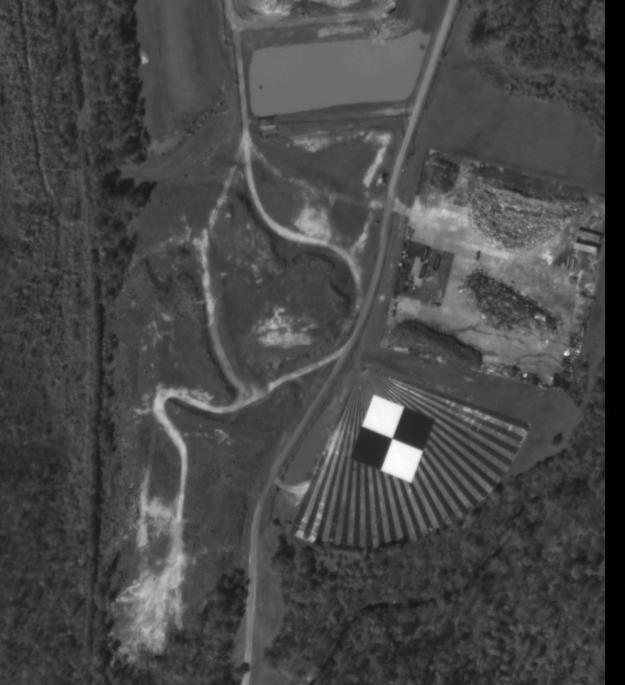
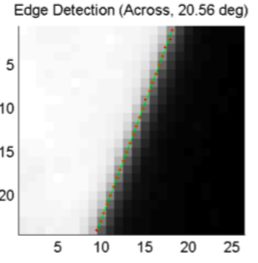
If we take a closer look at the square, we can see that the border is somehow distributed on several pixels, creating a transition region (and not a sharp cut between the two regions):
Temporal resolution
Temporal resolution is the frequency at which the satellite revisits the same area to capture new images, affecting how frequently changes over time can be monitored. Depending on the application this can be very relevant. Because temporal resolution is related to the revisiting time, satellites operating on higher orbits usually have better temporal resolution than those operating on lower ones. The problem with higher altitudes is that the spatial resolution is lower than those of lower orbits. In order to have high spatial resolution and high temporal resolution, a constellation of satellites is generally deployed (for example Planet or Satellogic are two companies operating a constellation of small satellites with very high resolution using low orbits).
Examples of remote sensing applications
The number of uses of remote sensing data is huge. Although it started as a military field (and it continues to be one of the main uses), remote sensing is now widely spread along very different applications. We will explore some of them, grouped by type of remote sensing application, but keep in mind that this is just a minimal sample of all the possible applications that can benefit from remote sensing data.
Agriculture & Climate Change
Monitoring crop health, soil conditions, and land productivity through multispectral and hyperspectral imagery assists in precision farming. This ensures efficient fertilizer use, pest management, and crop yield estimation, ultimately contributing to food security. Monitoring land use, particularly crop estimation, is one of Digital Sense active research topics. In collaboration with INIA and UdeLaR, we've published two articles: Automatic Classification of Agricultural Summer Crops in Uruguay (2021) and Sentinel-2 Analysis for Classification of Winter Crops in Uruguay (2024).
Monitoring land use and crop management is also key for soil preservation. For instance, we've implemented a GIS solution on a National level to manage and monitor land use from agricultural projects.
Urban and regional planning
Urban and Regional Planning: Remote sensing can monitor urban expansion, infrastructure development, and land use change. It helps city planners manage growth sustainably and ensures cities are resilient to environmental stresses. Our work on changes in the watercourse of a river in Uruguay is an example of how remote sensing can be used for urban and regional planning.
Natural disasters
Geology and Natural Disasters: Remote sensing maps geological formations, tracks volcanic activity, and monitors earthquake-prone areas. It’s crucial for understanding fault lines and predicting disasters, such as landslides and tsunamis, while assisting in rapid disaster response and recovery.
Technology and devices
As mentioned before, satellites can be divided into passive and active devices, depending on how the image is formed. Among the passive satellites, optical satellites are the most common ones. These satellites operate in the visible portion of the spectrum, sometimes going further into the near-infrared section. Depending on the spectral resolution, these satellites are divided between multispectral and hyperspectral satellites. In the case of multispectral sensors, the resolution of each sensed band is wider than in the case of hyperspectral bands.
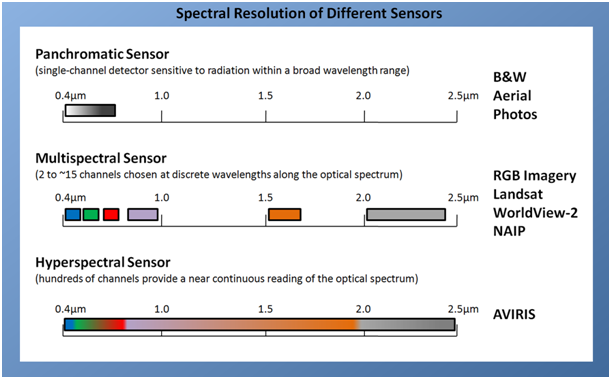
Multispectral satellites are by far the most widely used earth observation satellites, being Landsat and Sentinel-2 two of the most well known.
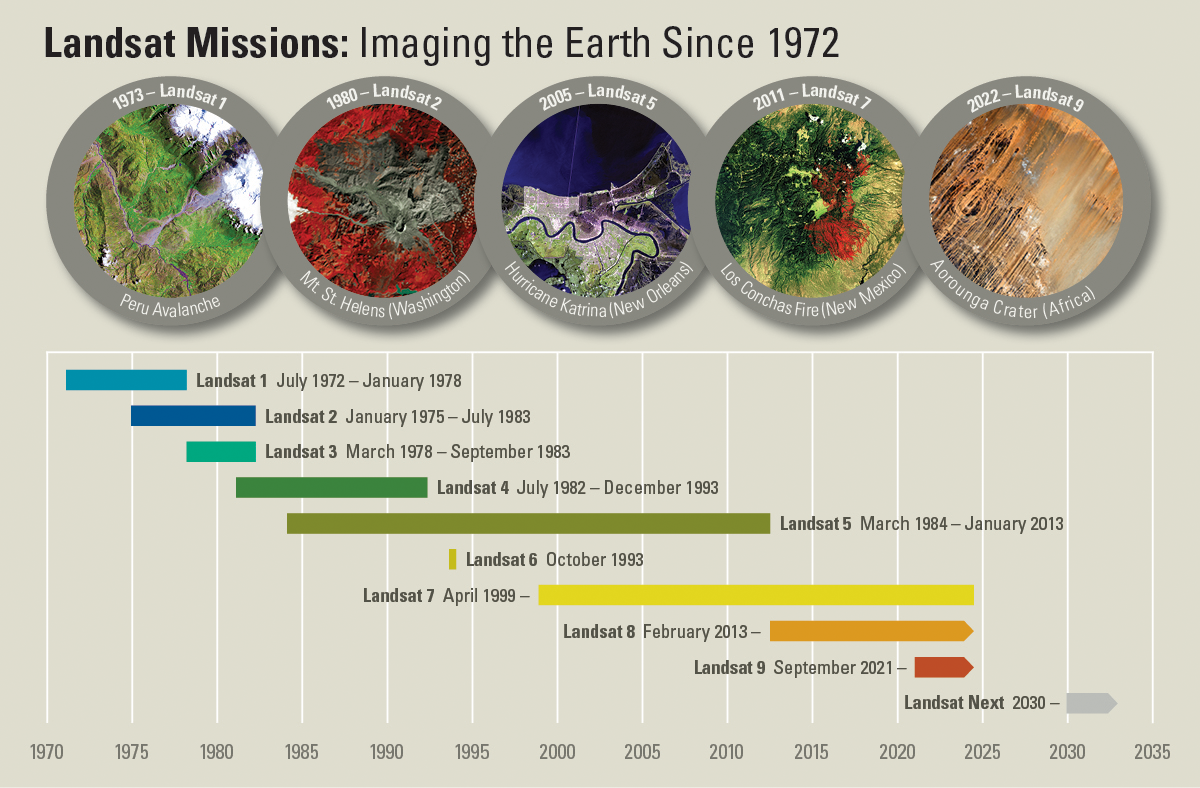
Landast is, no doubt, the most successful earth observation program of all times. Starting back into the early 70s, some of the satellites in this program were operating until recently. In particular, Landsat 5 operated for nearly 28 years !
Sentinel-2 is the multispectral medium resolution European satellite constellation, operating since 2015.
Both Landsat and Sentinel-2 are widely used not only because of their spatial resolution (between 30 to 10 meters), their spectral resolution (8 to 12 bands covering most of the visible spectrum, NIR, and thermal), and their temporal resolution (revisit between 16 and 7 days) but also because all the data is freely available, so anybody can use this huge amount of up-to-date information.
Another type of satellite is those known as Very High Resolution (VHR) Satellite Images. Most of the recent SmallSat constellations are in this segment. For a review of the situation in this segment, please refer to our article on the SmallSat Symposium 2024.
Finally, we want to mention hyperspectral satellites. These satellites are generally experimental, but provide an incredible source of information. In this case, the spectral band is divided into very narrow bands, which enables it to analyze very specific sections of the spectrum. This is very important for several applications (for instance, when crops suffer stress because of a plague, specific spectral bands are affected). The problem with these satellites is that the data is generally unavailable, and if it is available, it is only for a small collection. Hyperion (decomised in 2017) and Prisma are two of the most well-known hyperspectral satellites.
The importance of remote sensing in modern science
Several instruments and satellites are devoted to very specific scientific activities. Some examples of this contribution are the following:
Environmental Monitoring: Remote sensing offers invaluable insights into ecosystem health, deforestation, biodiversity, and vegetation patterns, which are crucial for conservation. By tracking changes in land cover and forest density, it helps scientists understand and manage natural resources sustainably. At Digital Sense, we are committed to contributing in this area; an example of our work on this area is an analysis of the presence of cyanobacterias on water bodies. And if you are interested in putting your hands to work on a remote sensing application, we encourage you to take a look at our series of monitoring deforestation with open data and machine learning (part 1 and part 2).
Climate Science: Satellites help measure atmospheric components, ocean temperatures, ice cover, and greenhouse gas concentrations, all essential for climate change research. Long-term data from remote sensing informs climate models, aiding in forecasting and understanding climate impacts on a global scale.
One of the works we've done at Digital Sense was related to SMOS Satellite. The Soil Moisture and Ocean Salinity mission (SMOS) was designed to measure two essential variables for understanding environmental and climate dynamics: soil moisture and ocean salinity. These parameters are critical for monitoring Earth's water cycle and are influenced by constant interactions between oceans, atmosphere, and land. Soil moisture data aids hydrology research, while ocean salinity measurements help improve models of ocean circulation—both vital for accurately modeling climate change.
As the first mission to provide global L-band microwave observations of these factors, SMOS leverages microwave emissions from Earth, capturing reflected signals to assess variations in soil moisture and sea surface salinity. Meeting the scientific demands for near-daily revisits, a broad field of view, and lower resolution meant that direct measurement wasn’t feasible due to the need for a prohibitively large antenna. Instead, this challenge was overcome through 'interferometry,' a technique that enables SMOS to efficiently collect this data without the need for oversized hardware.
Hydrology: Water resources are essential for human and ecological health, and remote sensing helps track parameters like soil moisture, precipitation, and river flow. Observing these variables enables better water management and prediction of flood or drought events. In the use of SAR images to monitor water resources, we explain how we've used Sentinel-1 data to detect and estimate water reservoirs.
Challenges and future of remote sensing
One of the main challenges of remote sensing is Data Processing and integration with AI solutions. Handling vast amounts of satellite data is challenging, and integrating with AI and cloud computing presents additional challenges. One important challenge is the standardization process to integrate and use data from different sources. Although some companies provide mechanisms to access open data (the most clear case is Google Earth Engine), there are no standards to handle satellite data.
Another challenge is resolution. Balancing high spatial and temporal resolution requires advanced, costly sensors. Smaller satellites and CubeSats offer more frequent revisit times and better monitoring capabilities but most of these satellites are commercial options, which prevent the spread of their use.
Another challenge is to provide more options to deal with Atmospheric Interference Clouds and other atmospheric elements affecting optical data, but synthetic aperture radar (SAR) and improved correction algorithms are offering solutions. One of the problems with SAR data is the resolution: although there are satellites providing high-resolution SAR images (COSMO-SkyMed), the cost is still an issue. New Small Satellite constellations like Capella Space will provide higher resolution at lower costs.
Finally, we can mention cost and accessibility. High-resolution data is expensive and even if you are willing to pay, the process to acquire satellite data is not easy. The process usually involves human intervention ("Contact our team" or "Ask for a quote", etc.), with the delays that this process generates.
At Digital Sense we are committed to apply Remote Sensing Data to different industries and applications. For a complete review of our services, please check out our remote sensing services.
.jpg)


